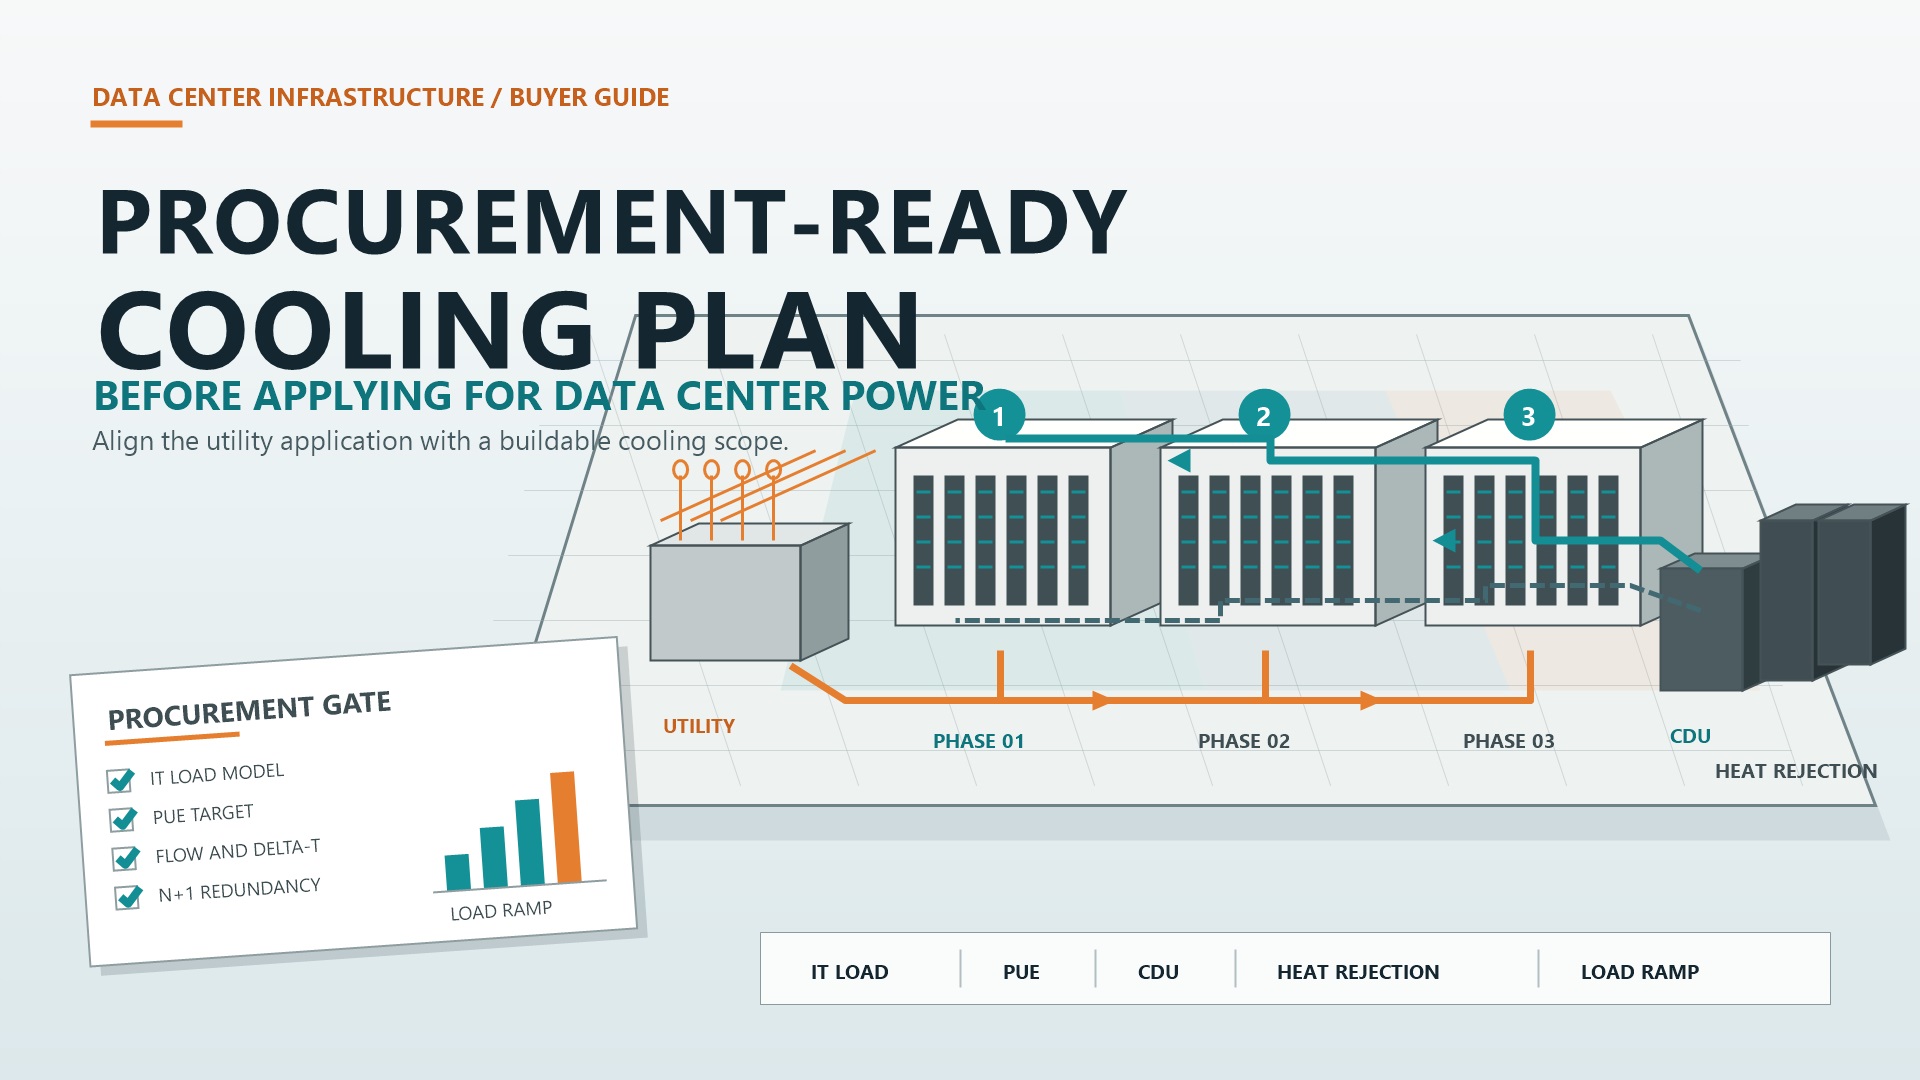
The utility application is the wrong place to discover that a 100MW AI campus actually needs 122MW at the meter.
Yet this happens when developers apply for power using only the expected IT load. The cooling plant, pumps, fans, CDUs, water-treatment equipment, UPS losses and auxiliary systems are added later, turning the original power request into an incomplete load forecast.
That mistake is becoming more expensive.
Dominion Energy’s public data center request workflow identifies a site plan, load letter and load ramp schedule among the information customers should provide. Meanwhile, the Federal Energy Regulatory Commission’s June 2026 large-load action focused attention on clearer interconnection processes, network-upgrade costs and flexible service for loads above 50MW connecting above 69kV.
The FERC action is a regulatory proceeding, not a guarantee of faster power. Still, it sends a practical message to data center developers:
Projects that can explain their real load, deployment phases and operating flexibility are better prepared for utility discussions.
A procurement-ready cooling plan gives the utility a defensible facility load while giving equipment suppliers enough information to quote CDUs, pumps, dry coolers, cooling towers, chillers, controls and modular cooling systems.
1. Start With Five Different Power Numbers
“Power requirement” should never appear as one unexplained number in a data center application.
The project team should define at least five values:
| Power Value | Definition | Procurement Impact |
|---|---|---|
| Utility service capacity | Maximum power requested at the point of delivery | Determines grid studies and electrical infrastructure |
| IT design load | Maximum planned server, storage and network load | Establishes the primary heat load |
| Normal facility load | Expected IT and infrastructure load during normal operation | Supports operating cost and tariff analysis |
| Summer peak facility load | Highest coincident load under design weather | Determines whether the utility request is large enough |
| Minimum or curtailable load | Load that must remain online during a grid event | Supports flexible service discussions |
The IT design load is not the same as the utility service capacity.
Cooling power also changes with outdoor temperature, IT utilization, liquid-cooling percentage, redundancy state and the number of operating capacity blocks. Therefore, one annual-average PUE value cannot describe every operating condition.
2. Convert IT Capacity Into Facility Power
PUE is calculated as:
PUE = Total facility energy ÷ IT equipment energy
For a simplified 100MW IT campus:
| Design PUE | IT Load | Total Facility Load | Facility Overhead |
| 1.10 | 100MW | 110MW | 10MW |
| 1.18 | 100MW | 118MW | 18MW |
| 1.25 | 100MW | 125MW | 25MW |
The facility overhead includes cooling, electrical losses, lighting, controls and other infrastructure. It is not cooling power alone.
Google reports a trailing 12-month PUE of approximately 1.09 across its mature hyperscale data center fleet. That is a useful industry reference, but it should not be copied directly into a new project’s power application.
A new campus may operate at partial load for several years. It may also face higher summer temperatures, different redundancy requirements and less optimized equipment sequencing. Those conditions can produce a higher peak PUE even when the long-term efficiency target is aggressive.
Use an operating range, not a marketing target.
The utility-facing load letter should show normal load, seasonal peak load, first-phase load and ultimate build-out load.
Pro Tip: Do not multiply the final IT capacity by the best expected annual PUE and call that the utility requirement. The electrical application should be based on the worst credible coincident facility load, while the business model can use an annual energy estimate.
3. Freeze the Compute and Cooling Design Envelope
A cooling plan cannot become procurement-ready until the project establishes what it is cooling.
The design envelope should include:
Server and GPU platform
Maximum rack power
Number of racks in each phase
Direct-to-chip, immersion or hybrid cooling architecture
Liquid heat-capture ratio
Coolant supply and return temperatures
Minimum rack flow
Maximum pressure drop
Coolant chemistry requirements
Residual air-cooling load
Expected training and inference load patterns
Future hardware upgrade range
Do not use average rack power for infrastructure sizing. AI training clusters can create sustained high loads, while workload changes can also produce rapid power variations.
At the same time, avoid purchasing the entire cooling plant around one server generation. Later deployment phases may use higher-density hardware with different flow, pressure and coolant-temperature requirements.
The goal is to establish a validated range that supports present procurement without preventing future expansion.
4. Select the Liquid-Cooling Temperature Class Early
Coolant temperature is not a minor CDU setting. It influences the entire power application.
ASHRAE’s AI Data Center Energy Performance Framework presents revised liquid-cooling classes including W17, W27, W32, W40, W45 and W+. The number reflects the upper supply-water temperature associated with the class.
A lower coolant-supply temperature may require mechanical chilling for more hours of the year. A warmer loop can increase dry-cooling and free-cooling opportunities, reducing compressor power.
However, the selected temperature must remain within the validated limits of the server, cold plate, manifold and CDU.
The temperature decision affects:
Chiller capacity
Dry-cooler size
Cooling-tower operating hours
Pumping requirements
Approach temperature across the CDU
Annual cooling electricity
Summer peak power
Water consumption
Heat-reuse potential
This is why coolant temperature must be agreed before the utility application is finalized. Changing from a warm-water dry-cooler system to a chilled-water system later may materially increase the requested electrical capacity.
5. Calculate the Liquid and Residual Air Loads Separately
Direct-to-chip liquid cooling may not capture all server heat.
Suppose a 100MW IT deployment has an 80% validated liquid heat-capture ratio:
Liquid cooling load: 80MW
Residual air-cooling load: 20MW
Using water-like fluid properties, the approximate facility-water flow for the 80MW liquid load would be:
| Design ΔT | Approximate Flow |
| 10K | 6,880m³/h |
| 15K | 4,590m³/h |
| 20K | 3,440m³/h |
These are simplified heat-balance calculations. Actual flow depends on glycol concentration, elevation, pipe resistance, fouling, heat-exchanger approach temperature and equipment operating limits.
Increasing ΔT can reduce flow, pipe size and pump energy. However, a larger ΔT is only valuable when the servers, CDUs and heat-rejection equipment can operate at the resulting return temperature.
The remaining 20MW of air-side heat still needs a defined cooling path. Depending on the architecture, that may include fan walls, air handlers, rear-door heat exchangers or other air-cooling equipment.
Pro Tip: Ask the server supplier for a heat-capture ratio tied to the exact server configuration and maximum validated workload. “Liquid-cooled server” is not a complete thermal specification.
6. Build a Seasonal Cooling Power Model
A procurement-ready cooling plan should calculate equipment power under several operating conditions, not only at one outdoor temperature.
At minimum, model:
Normal winter operation
Normal summer operation
Summer design-day peak
One cooling train unavailable
Partial-load first-phase operation
Utility outage and backup-power operation
Restart after power restoration
For each condition, calculate the expected power of:
CDU pumps
Facility-water pumps
Dry-cooler fans
Cooling-tower fans
Chillers
Condenser-water pumps
Air-handling fans
Water-treatment equipment
Heat tracing and freeze protection
Controls and auxiliary equipment
The summer design-day value is especially important for the utility application because dry-cooler capacity and fan power change as ambient temperature approaches coolant temperature.
Chiller power can also become a major peak load when the system transitions from free cooling to mechanical cooling.
The utility does not only need annual energy. It must understand the maximum coincident demand.
7. Compare Heat-Rejection Options Before Freezing the Load Letter
| Heat-Rejection System | Power Application Benefit | Main Risk |
| Dry cooler | Avoids chiller and cooling-tower power in suitable conditions | Higher fan power and reduced capacity in hot weather |
| Cooling tower | Can produce lower water temperature based on wet-bulb conditions | Water use, treatment, pumps and permitting |
| Chiller | Maintains a stable low supply temperature | High summer electrical demand and mechanical complexity |
| Hybrid system | Balances water, energy and peak-weather performance | More complex controls and transition sequences |
| Thermal storage | Shifts cooling electricity away from grid peaks | Additional space, controls and capital cost |
The correct system cannot be selected from PUE alone.
A dry-cooling strategy may reduce WUE but require more fan energy and larger heat exchangers. Evaporative cooling may improve electrical efficiency while increasing water consumption. Chillers can provide temperature certainty, but they may increase both service capacity and standby-generation requirements.
The cooling plan should show the selected architecture, an alternative architecture and the reason the final option was chosen.
8. Define CDU Capacity at Actual Operating Conditions
CDU nameplate capacity is not always the capacity available to the project.
Usable performance depends on:
Facility-water inlet temperature
Technology-water supply temperature
Approach temperature
Fluid type
Required flow
Pump head
Heat-exchanger pressure drop
Fouling allowance
Redundancy arrangement
The Open Compute Project’s CDU guidance emphasizes specification, qualification and operational assurance rather than relying only on nominal megawatt ratings.
For utility planning, CDU power should include active pumps, standby strategy, controls and any operating mode in which additional units start during high temperature or component failure.
For equipment procurement, the RFQ should request guaranteed performance at the project’s actual design conditions.
Pro Tip: Separate cooling-capacity margin from N+1 redundancy. Twenty percent extra nameplate capacity does not guarantee that the system can maintain flow, pressure and temperature after one unit fails.
9. Show the Utility How the Load Will Ramp
A 120MW campus rarely reaches full power on the first day.
The power application should include a realistic load ramp, such as:
| Project Stage | IT Load | Cooling Status | Facility Load |
| Construction and commissioning | Limited temporary load | Pumps and controls under test | Project-specific |
| Phase 1 energization | 20MW | First cooling block commissioned | Based on Phase 1 peak PUE |
| Phase 2 deployment | 50MW | Additional CDU and heat-rejection blocks | Based on Phase 2 peak PUE |
| Phase 3 deployment | 80MW | Campus loop expanded | Based on Phase 3 peak PUE |
| Ultimate build-out | 100MW | Full cooling plant available | Maximum design facility load |
The dates and values must match the actual construction and server-delivery schedule.
Applying immediately for ultimate capacity may be necessary in a constrained market, but the project should still explain when each block will energize. Utilities need this information for transmission, substation and generation planning.
A modular cooling architecture makes the ramp schedule easier to defend because cooling equipment can be tied to specific IT capacity blocks.
10. Control Motor Starting and Restart Demand
The utility will care about more than steady-state megawatts.
Large chillers, pumps and fans can create starting current, voltage disturbance and sudden load steps. The project should therefore define:
VFD use
Sequential motor starting
Maximum simultaneous motor start
Chiller restart delay
Pump lead-lag sequence
Automatic load shedding
Harmonic characteristics
Power factor
Reactive power requirements
Black-start and restoration sequence
After an outage, starting every CDU, pump, fan and chiller simultaneously can create a facility demand spike that exceeds the normal operating load.
The controls narrative should specify how cooling capacity returns in stages while server temperatures remain protected.
11. Quantify Cooling Flexibility Without Risking Uptime
FERC’s 2026 large-load action has increased attention on flexible service and demand-responsive loads. ASHRAE’s grid-interactive framework also identifies cooling optimization, pre-cooling and thermal storage as possible sources of demand flexibility.
That does not mean the entire cooling system can simply be turned off.
A credible flexibility plan should state:
Maximum cooling load that can be reduced
Response time
Maximum event duration
Maximum number of events
Required recovery period
Ambient-temperature limits
IT-load conditions
Redundant equipment that must remain available
Effect on supply temperature
Effect on service-level commitments
Possible strategies include pre-cooling, chilled-water or ice storage, temporary fan-speed adjustment, pump optimization, warmer coolant setpoints within approved limits and shifting non-critical computing workloads.
Flexibility must be measurable and repeatable. Do not promise a curtailment number that has not been validated through controls testing and thermal modeling.
12. Divide the Project Into Repeatable Capacity Blocks
A single campus-wide cooling system creates a large common failure domain and makes phased procurement difficult.
Instead, align cooling blocks with electrical and IT deployment blocks.
For example, a 100MW campus could be divided into five 20MW IT phases. Each phase could include dedicated or zoned:
CDUs
Facility-water pumps
Heat-rejection equipment
Electrical distribution
Controls
Leak detection
Isolation valves
Water-treatment interfaces
Metering
The exact capacity block depends on the rack layout and redundancy strategy. The principle is to connect each equipment purchase to a specific amount of commissionable IT capacity.
This approach also allows the project team to complete FAT, deploy the first block, measure real performance and correct the design before repeating it.
13. Prepare the Cooling Procurement Package
Before requesting binding supplier quotations, complete the following documents:
Cooling Basis of Design
Define IT load, rack density, cooling method, supply and return temperatures, heat-capture ratio, site climate, water conditions, redundancy and performance targets.
Heat and Mass Balance
Show heat load, liquid flow, residual air load, water consumption and heat-rejection capacity for normal, peak and failure conditions.
Equipment Schedule
List CDUs, pumps, dry coolers, towers, chillers, air handlers, expansion systems, filtration and water-treatment equipment.
Hydraulic Diagram
Define facility-water loops, technology-water loops, pressure boundaries, isolation zones, bypasses, drains and fill points.
Electrical Load Schedule
Provide running power, standby power, starting current, voltage, frequency, power factor and harmonic data.
Sequence of Operations
Explain normal startup, partial-load control, lead-lag rotation, failure response, emergency shutdown and restart.
Interface Responsibility Matrix
State who supplies piping, cables, valves, sensors, network connections, structural supports, insulation, water treatment and onsite labor.
FAT and SAT Plan
Define performance tests, calibrated instruments, acceptance criteria, load simulation, communication tests and required reports.
Pro Tip: “CDU package,” “dry-cooler package” and “factory tested” are not sufficient procurement descriptions. Define the project boundary and acceptance criteria before comparing prices.
14. Align the Cooling RFQ With the Utility Application
The cooling RFQ and utility load letter should use the same baseline.
Check that both documents contain matching values for:
IT capacity by phase
Normal facility load
Summer peak facility load
Cooling redundancy
Ultimate build-out
Energization dates
Voltage and frequency
Backup-generation strategy
Load-shedding capability
Restart sequence
PUE assumptions
When the cooling supplier designs around 100MW IT but the utility studies only 110MW total facility power, a summer design-day load can expose the mismatch.
Late corrections may require a larger transformer, additional feeder capacity, a revised substation or another utility study.
15. Calculate ROI From Time to Commissioned Power
Cooling ROI should not be measured only by equipment price.
A more useful model is:
Cooling TCO per commissioned IT MW =
Equipment + electrical integration + piping + logistics + installation + commissioning + energy + water + maintenance + spares + delay exposure
÷
Commissioned IT capacity
The financial impact of a power delay can be estimated as:
Delay exposure = unavailable IT MW × contribution per MW-day × delay days + financing and contract costs
A slightly more expensive modular cooling package may generate a better return when it shortens installation, reduces onsite rework and supports earlier energization.
By contrast, inexpensive equipment with incomplete electrical data or unclear interfaces may delay the utility application and cost more than the original purchase-price saving.
Procurement-Ready Cooling Checklist Before Applying for Power
Confirm the following before submitting the application:
IT capacity by development phase
Maximum rack power
Server and GPU platform
Liquid heat-capture ratio
Residual air-cooling load
Coolant temperature class
Facility and technology-water temperatures
Design flow and pressure drop
Normal and summer peak PUE
Cooling equipment running power
Motor-start and restart loads
Heat-rejection architecture
Site dry-bulb and wet-bulb conditions
Water availability and WUE target
Cooling redundancy
Maintenance operating mode
Load ramp schedule
Minimum critical load
Curtailable load
Backup-generation strategy
Utility voltage and point of delivery
CDU guaranteed performance
Controls and BMS/DCIM protocols
FAT, SAT and commissioning requirements
Expansion interfaces for future phases
Final Procurement Verdict
Do not apply for data center power using an IT megawatt target and a hoped-for PUE.
Build the cooling basis first. Define the server heat load, liquid-cooling percentage, temperatures, flow, heat rejection, seasonal power, redundancy and restart behavior. Then convert that information into a utility load letter and phased ramp schedule.
The result does not need to be a final construction drawing. It must be detailed enough that the utility can study a credible facility load and cooling suppliers can provide comparable quotations.
Plan the cooling system before the power application. Procure the first capacity block before the promised energization date.
ACT-Boxes supports modular AI data center cooling infrastructure, including CDUs, dry coolers, liquid loops, power distribution, controls, factory testing, delivery and onsite commissioning coordination. A useful proposal begins with the phase-by-phase IT load, server coolant requirements, site climate, PUE/WUE targets, redundancy strategy and utility schedule.
FAQ
Should the data center apply for power before selecting the cooling architecture?
The final equipment model does not have to be selected, but the cooling architecture, temperature range, peak cooling power and redundancy strategy should be defined before submitting the utility load request.
Is the IT load the same as the utility service capacity?
No. Utility service capacity includes IT equipment and facility infrastructure such as cooling, electrical losses, pumps, fans and controls.
Which PUE should be used in the power application?
Use a defensible peak facility-load assumption based on design weather, operating mode and redundancy. Do not rely only on the expected annual-average PUE.
Can liquid cooling reduce the requested power capacity?
It may reduce cooling electricity when combined with suitable coolant temperatures and efficient heat rejection. However, liquid cooling does not automatically guarantee a lower PUE. Pumps, CDUs, residual air cooling and site conditions must be included.
What cooling documents should be sent to the utility?
Requirements vary, but useful documents include the load letter, phase ramp schedule, electrical load schedule, cooling operating modes, motor-start data, backup-generation strategy and demand-flexibility description.