High Delta T or Low Flow? How to Tell the Difference
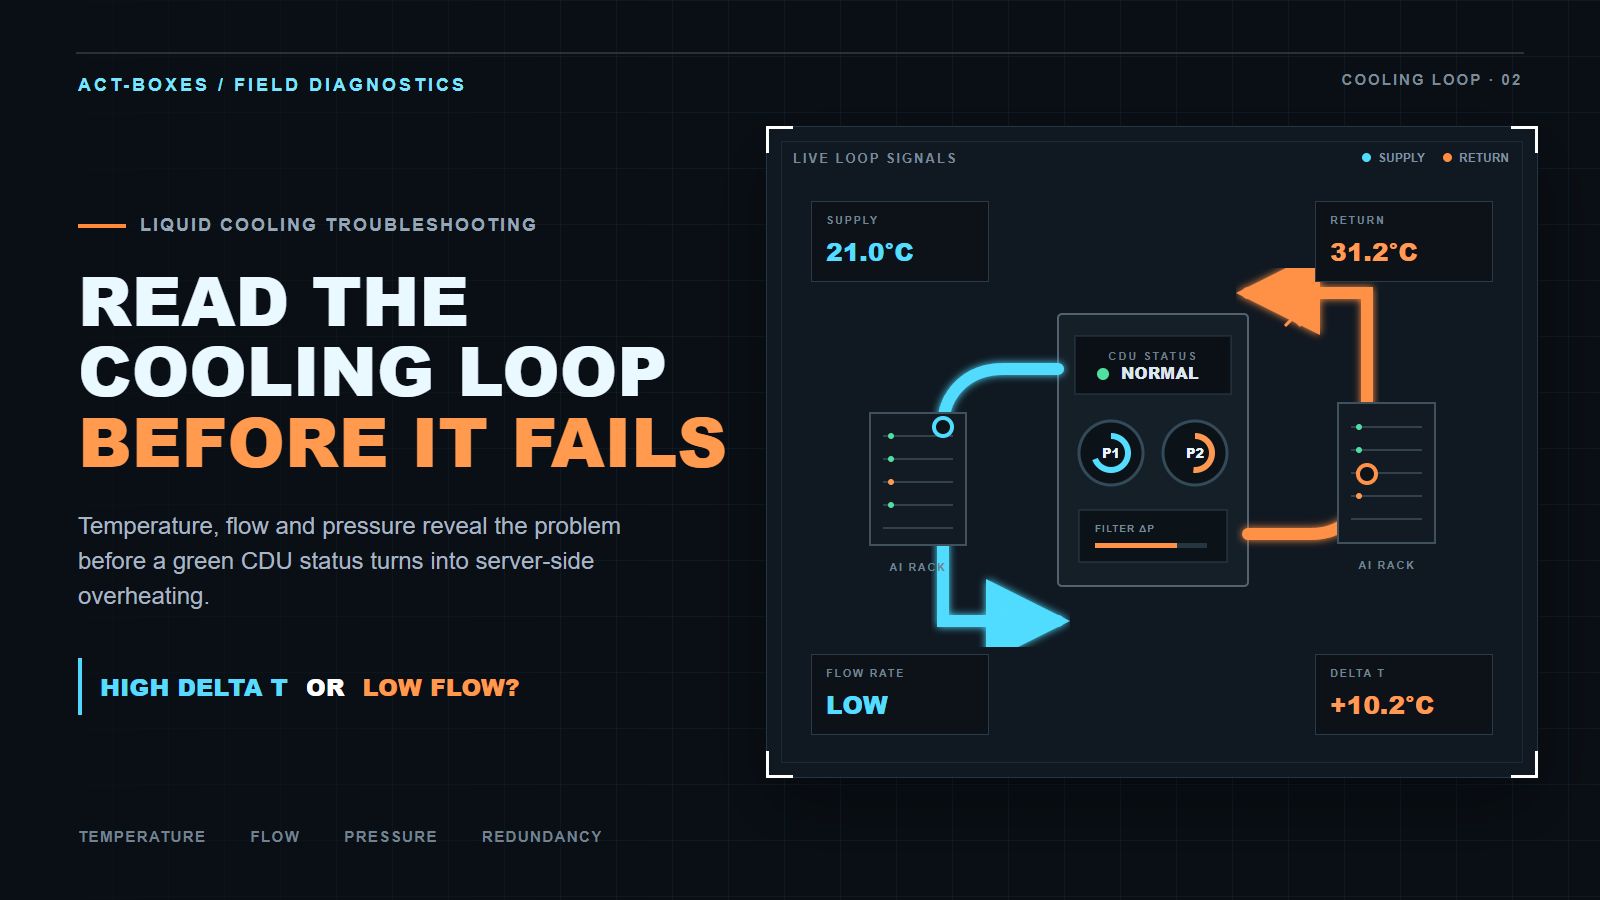
A CDU can show a normal status while the servers at the end of the loop are already running too hot.
That situation is common in liquid-cooled AI data centers, high-density GPU infrastructure and liquid-cooled ASIC mining systems. The problem is usually not a single failed component. It is often a mismatch between what the control panel reports and what the cooling loop is actually delivering.
A pump can be running without delivering design flow. A CDU can have enough nameplate capacity while a branch circuit remains starved. A high supply/return temperature difference can indicate a heavy IT load, but it can also be the first sign of restricted flow.
The key question is simple:
Are you seeing high delta T because the load increased, or because the loop is not moving enough coolant?
The answer comes from reading temperature, flow and pressure together.
Start With the Heat Balance
For a liquid-cooling loop, the basic heat relationship is:
Q = m × Cp × ΔTWhere:
Q= heat removedm= coolant mass flowCp= specific heat capacity of the coolantΔT= return temperature minus supply temperature
This equation explains why delta T should never be analyzed by itself.
If the heat load remains stable and the flow decreases, the return temperature will normally rise and the delta T will become larger. If the IT load increases while flow remains unchanged, the same pattern may appear. The temperature readings can look similar, but the corrective action is completely different.
If the issue is higher load, the system may need additional cooling capacity. If the issue is low flow, increasing cooling capacity will not solve the restriction.
The first step is to confirm four measurements at the same time:
Supply temperature
Return temperature
Actual total flow
Pump differential pressure
Do not rely only on the CDU display. Check where the sensors are installed, whether the readings are calibrated and whether they represent the CDU inlet, the rack manifold or the server-side loop.
Pro Tip: Record the four values during normal operation, peak load and reduced pump speed. The change in the readings is often more useful than one isolated number.
High Delta T Does Not Always Mean Efficient Cooling
A high delta T is sometimes viewed as proof that the cooling system is working efficiently. That interpretation is incomplete.
A high temperature difference may be acceptable when:
The heat load is close to the design point
The flow is within the approved design range
Branch temperatures are balanced
The return temperature remains below the equipment limit
The heat exchanger still has sufficient approach-temperature margin
A high delta T becomes a warning sign when it appears suddenly or is accompanied by other changes.
Look for these patterns:
| Observation | Possible Meaning |
|---|---|
| Supply temperature stable, return temperature rises | Heat is not being removed quickly enough |
| Total flow decreases at the same pump speed | Restriction, air, fluid-property change or pump issue |
| One branch is much hotter than the others | Poor balancing, partial blockage or branch starvation |
| Delta T falls when pump speed increases | Flow may be too low |
| Delta T remains high after pump speed increases | Check heat load, heat exchanger performance and sensor accuracy |
| Return temperature rises across all branches | System-level capacity, flow or heat-rejection problem |
| Only one cabinet overheats | Local branch, cold plate, manifold or server-side issue |
The location of the temperature increase matters. A rising temperature across the entire loop suggests a system-level issue. A hot section at the end of one branch points toward distribution, balancing or local restriction.
How to Prove Whether Flow Is Really Low
A pump running is not proof that the loop is delivering design flow.
Actual flow can be reduced by:
Incorrect pump speed command
An undersized pump or insufficient pump head
A partially closed isolation or balancing valve
A clogged filter or strainer
Air trapped in the pipework
Higher-than-designed glycol concentration
Lower coolant temperature and higher viscosity
Excessive manifold or branch pressure drop
A damaged impeller or pump-control fault
Incorrect or poorly installed flow-metering equipment
Start with the flow meter, but do not accept the displayed value without context. Compare the reading with the approved design flow at the same pump speed, fluid temperature and coolant composition.
If total flow is low, check whether all branches are equally affected. A low total flow with balanced branches suggests a pump, system restriction or control problem. A normal total flow with one overheated branch suggests that flow is being distributed incorrectly.
A useful field test is to increase pump speed gradually while observing:
Total flow
Supply and return temperatures
Pump differential pressure
Branch flow
Filter differential pressure
Pump noise and vibration
If flow increases and delta T falls, the system may have been operating below its required flow. If pump speed rises but flow barely changes, the loop may be restricted or the pump may be operating outside its effective curve.
Increasing pump speed without checking pressure drop and NPSH margin can create a new problem. It may increase noise, accelerate filter loading or push the pump toward unstable operation.
Pro Tip: Never approve a cooling-loop diagnosis based on “the pump is on.” Ask for measured flow at the server-side or branch level whenever possible.
Pressure Drop Is the Fastest Clue for a Blocked Filter
A filter can look clean from the outside and still restrict the loop.
Dust, construction debris, corrosion products, biological growth and fluid-treatment residue can accumulate inside strainers and filters. As the filter loads, the pressure difference between its inlet and outlet increases. The pump may continue running, but the downstream flow gradually falls.
That makes filter differential pressure one of the most useful trend values in liquid cooling.
Monitor:
Filter inlet pressure
Filter outlet pressure
Differential pressure across the filter
Total flow at a stable pump speed
Branch temperatures
Fluid cleanliness
A rising filter differential pressure combined with falling flow is a stronger blockage indicator than a high delta T by itself.
Heat-exchanger fouling can create a similar symptom. In this case, the loop may still have reasonable flow, but the heat exchanger cannot transfer heat as effectively. The approach temperature increases, and the return temperature may remain higher than expected.
The troubleshooting path is different:
High filter differential pressure: inspect, clean or replace the filter element according to the maintenance procedure.
Normal filter pressure but poor heat transfer: check the heat exchanger, fluid quality, fouling and secondary-side heat rejection.
High pressure drop across a branch: check valves, hose routing, manifold restrictions and local contamination.
Do not simply increase the pump setpoint to compensate for a dirty filter. That can mask the problem temporarily while increasing pump energy and mechanical stress.
Trapped Air in the Loop: Flow Instability Before Pump Failure
Gas pockets and bubbles can create cooling issues that mimic poor pump performance.
Common scenarios for air ingress include:
Initial filling
Maintenance or component replacement
Low expansion-tank level
Poor venting
Loose fittings
Negative pressure at the pump inlet
Incorrect pipe routing
Inadequate air separation
Typical signs include:
Fluctuating flow readings
Gurgling or bubbling sounds
Unstable pump differential pressure
Temperature swings at the end of a branch
Visible bubbles in a sight glass
Short periods of normal operation followed by overheating
Pump noise that changes with system load or valve position
Air entrainment and cavitation are related but should not be treated as the same fault.
Air in the system often produces unstable flow and irregular noise. Cavitation occurs when local pressure falls below the fluid’s vapor-pressure requirement and can create a harsher crackling or gravel-like sound. Low inlet pressure, insufficient NPSH margin, high fluid temperature or excessive suction-side restriction can increase cavitation risk.
The check should begin with the expansion tank, air separator, automatic vents and high points in the pipework. Confirm that the pump has adequate inlet pressure and that the system has been filled and vented according to the design procedure.
A flow meter that jumps up and down does not automatically mean the meter is defective. It may be reporting the real effect of air pockets moving through the loop.
Pro Tip: If flow is unstable, stabilize and remove air before changing pump parameters. Tuning a pump against an air-filled loop usually produces misleading results.
Glycol Concentration Can Quietly Change the Design
Many outdoor cooling systems use water-glycol mixtures to provide freeze protection. The coolant composition affects more than freeze protection.
Glycol concentration and fluid temperature influence:
Viscosity
Density
Specific heat
Thermal conductivity
Pump head requirement
Pressure drop
Heat-transfer performance
A higher glycol concentration generally increases viscosity and can increase the pressure required to maintain the same flow. Depending on the design, this may reduce actual flow or increase pump power. A lower concentration may reduce freeze protection and create a different operational risk.
The correct concentration depends on the site climate, minimum expected temperature, equipment materials, fluid supplier requirements and OEM limits. There is no universal percentage that should be applied to every CDU or dry-cooler system.
When flow or heat-transfer performance changes unexpectedly, verify the fluid instead of relying on the original commissioning record.
Recommended checks include:
Glycol concentration using a refractometer or approved test method
Fluid temperature
Fluid appearance and contamination
Water quality
System fill history
Any recent top-up with water or premixed coolant
An incorrect mixture can produce a slow decline in performance. The pump may still appear normal, but the same speed no longer produces the same flow. The heat exchanger may also require a larger temperature difference to remove the same heat load.
Why Normal CDU Status Does Not Prove N+1
A system can have spare capacity on paper and still fail to provide practical N+1 redundancy.
For example, a CDU may have two pumps installed, but the remaining pump may not deliver the required flow and pressure when one pump is offline. The system may also depend on a control sequence that reduces flow, increases delta T or leaves some branches under-cooled during changeover.
Real N+1 performance should be verified under the conditions that matter:
One pump or cooling module unavailable
Design or peak heat load
Actual coolant properties
Required supply temperature
Required flow and pressure
Normal valve positions
Expected control response
Alarm and switchover behavior
Nameplate capacity is not the same as usable redundancy.
The same principle applies to heat rejection. A dry cooler may have additional installed fan capacity, but the control logic, electrical supply, fluid circuit and operating temperature must all support the remaining capacity during a failure scenario.
For AI data center buyers, this should be addressed before procurement. The RFQ should request guaranteed operating points, not only maximum cooling capacity.
For liquid-cooled mining sites, the same check applies to CDU pumps, manifolds, dry coolers and the site electrical system.
A Practical Cooling-Loop Diagnostic Sequence
Use the following sequence before changing setpoints or ordering larger equipment.
1. Confirm sensor locations
Identify where supply, return, pressure and flow sensors are installed. Confirm that the readings are relevant to the overheated server or branch.
2. Verify sensor accuracy
Compare readings with a calibrated reference instrument where practical. A sensor error can create a false high delta T or hide a real problem.
3. Record the operating condition
Log IT load, outdoor temperature, supply temperature, return temperature, total flow, branch flow, pump speed and pressure.
4. Compare actual delta T with actual flow
Use the heat balance rather than judging delta T alone. Check whether the heat load changed before the temperature difference increased.
5. Check pump response
Increase or reduce pump speed within the approved operating envelope. Observe whether flow responds predictably.
6. Check differential pressure
Measure pump differential pressure, filter differential pressure and branch pressure where available.
7. Inspect filters and strainers
Look for rising differential pressure, contamination or a maintenance history that does not match site conditions.
8. Check for air
Inspect the expansion tank, air separator, vents, sight glasses and high points. Listen for unstable pump noise.
9. Verify coolant properties
Confirm glycol concentration, fluid temperature and water quality against the approved design basis.
10. Check branch balance
Compare flow and temperature across branches. A normal total flow does not guarantee equal distribution.
11. Check heat-exchanger performance
Review approach temperature, fouling indicators and the interface with the dry cooler or other heat-rejection equipment.
12. Test N+1 independently
Simulate one-pump-out or one-module-out operation at the required load. Do not treat unused nameplate capacity as proof.
This sequence helps prevent a common procurement mistake: increasing cooling capacity when the actual issue is flow restriction, air, poor balancing or incorrect fluid properties.
The Five Measurements Operators Should Trend
A live dashboard should show more than supply temperature.
At minimum, trend:
Supply temperature
Shows the coolant temperature entering the server or cabinet loop.Return temperature
Shows how much heat the loop is bringing back to the CDU.Delta T
Helps identify changes in heat load, flow or heat-transfer performance.Actual flow
Confirms whether the loop is moving the required volume of coolant.Pressure differential
Helps identify filter loading, branch restrictions, pump behavior and air-related instability.
Additional useful values include:
Pump speed
Pump suction and discharge pressure
Filter differential pressure
Branch flow
Expansion-tank pressure
Outdoor temperature
Dry-cooler fan status
Glycol concentration
Heat-exchanger approach temperature
Alarm and switchover events
The value of trending comes from comparing variables over time. A single high return temperature is a symptom. A return temperature that rises while flow falls and filter differential pressure increases is a much clearer diagnosis.
When to Escalate From Adjustment to Redesign
Operational adjustments are appropriate when the system is within its approved design envelope and the issue is caused by control settings, trapped air, a dirty filter or an incorrect valve position.
Escalate to engineering review when:
Measured flow is below the design requirement at maximum approved pump speed
Pressure drop is higher than the design assumption
The pump cannot maintain required flow during N+1 operation
Branch temperatures remain uneven after balancing
Glycol concentration has changed the hydraulic design point
Heat-exchanger approach temperature continues to increase
The dry cooler cannot reject the required heat at the site design temperature
Sensors disagree or cannot be calibrated
Server-side temperatures exceed the equipment operating limit
The system repeatedly depends on manual intervention
The redesign may involve a different pump curve, larger pipework, additional filtration, improved air separation, revised manifold balancing, a different heat exchanger or more effective heat rejection.
The correct answer is not always “add capacity.” Sometimes the most valuable improvement is restoring the flow and pressure that the original design already required.
What Buyers Should Request in an RFQ
A procurement-ready liquid-cooling specification should include more than CDU cooling capacity.
Request the supplier to define:
Guaranteed heat load
Supply and return temperature
Required flow rate
Available pressure and pressure drop
Coolant type and concentration
Minimum and maximum operating temperature
Pump curve and control range
Filter rating and maintenance method
Air separation and venting arrangement
Heat-exchanger approach temperature
Sensor accuracy and measurement locations
Control and BMS/DCIM integration
Alarm and shutdown logic
One-pump-out or one-module-out performance
FAT and SAT test conditions
Site climate and dry-cooler interface
Commissioning and troubleshooting support
These details create a common design basis between the buyer, CDU supplier, server OEM, dry-cooler supplier and site contractor.
Without them, a system can pass a basic factory test and still struggle after deployment.
Cooling Loop Troubleshooting Checklist
Before concluding that the CDU is undersized, check:
Supply and return sensors are installed correctly
Sensor readings have been verified
IT load is known
Actual flow has been measured
Branch flow has been checked
Pump speed and pressure are within the design range
Filter differential pressure is normal
Valves are open and correctly balanced
Air has been removed from the loop
Expansion-tank pressure is correct
Glycol concentration has been verified
Heat-exchanger approach temperature is acceptable
Dry-cooler operation matches site conditions
N+1 operation has been tested under load
FAT/SAT records match actual site conditions
Final Verdict: Read the Relationship, Not One Number
The most useful cooling-loop diagnosis does not come from a single green status light or one temperature value.
It comes from the relationship between:
Supply temperature
Return temperature
Delta T
Actual flow
Pump differential pressure
Filter pressure drop
Branch balance
Coolant properties
Heat-rejection conditions
Redundancy behavior
A high delta T may indicate higher heat load. It may also be the result of low flow. A running pump may be starved by air, restricted by a clogged filter or operating against the wrong pump curve. A CDU may have capacity margin without providing real N+1 performance.
ACT-Boxes can help configure modular liquid-cooling systems around the actual project requirements, including heat load, flow, pressure, coolant concentration, pump redundancy, controls, BMS/DCIM integration, dry-cooler interface, FAT and SAT conditions.
Explore the CDU product page, AI data center solution and dry cooler system, or contact the ACT-Boxes team through the contact page to discuss your cooling-loop requirements.
FAQ
Is a high delta T always a problem?
No. A high delta T may be normal at a specific heat load and design flow. It becomes a warning sign when it rises unexpectedly, when return temperature exceeds the equipment limit or when flow and branch temperatures indicate restriction.
How can I tell the difference between high delta T and low flow?
Compare supply/return temperature with actual flow and pump differential pressure. If delta T falls when pump speed increases, low flow may be contributing to the problem. If flow is normal but return temperature remains high, check heat load, heat-exchanger performance and heat rejection.
Can a clogged filter cause high server temperature?
Yes. A loaded filter increases pressure drop and reduces downstream flow. The pump may continue running while the server-side loop receives less coolant.
Does a higher glycol concentration improve cooling?
Not automatically. Higher glycol concentration can improve freeze protection, but it generally changes viscosity, heat capacity and pressure drop. The correct concentration must be confirmed against site temperature, equipment materials and the approved design.
Does installed spare capacity prove N+1 redundancy?
No. N+1 must be tested at the required heat load, flow, pressure, coolant condition and supply temperature with one pump or cooling module unavailable.